Introduction

In this post we are going to discuss about how we can perform ETW tracing using krabsetw ETW library. We will not be discussing ETW basics here, for that I would recommend readers to check out following posts:
using krabsetw library
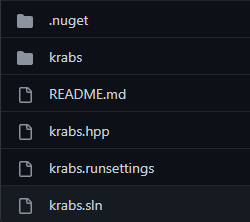
- Clone the krabsetw repo
- Go to krabs directory.
- Inside krabs directory, you will see krabs.hpp and another directory \”krabs\”. Drop these two in your project directory, thats it!
let the fun begins
Trace types
The ETW has mainly two sets of APIs provided to the user for consumption, theses APIs provide kernel and user space event tracing capabilities. Using Krabsetw we can define the type of trace we want to perform on the system. First step is setting the trace type in our code.
krabs::user_trace Utrace_object; //user space trace
krabs::kernel_trace Ktrace_object; //kernel space trace
Once the type is defined, we can use the trace object to perform various activities like starting and stopping a trace session.
Krabs lets define named and unnamed trace sessions
krabs::user_trace trace(L\"COOL_ETW_TRACE\"); //named trace
krabs::user_trace trace(); //unnamed trace
Named trace sessions help us to identify the sessions easily by using applications like logman.
choosing a provider
ETW provider provides events to an event tracing session. So beforehand we should have an idea of what we are trying to accomplish with ETW, then we can choose a specific provider the does the job for us. If you are totally new to all of this and want to explore more, use ETWExplorer by Pavel Yosifovich.
Suppose if we are interested in monitoring network related activities on the system, we can use one ETW provider called Microsoft-Windows-Kernel-Network to get information on processes that make the network connection along with other useful data like communication addresses and ports etc.
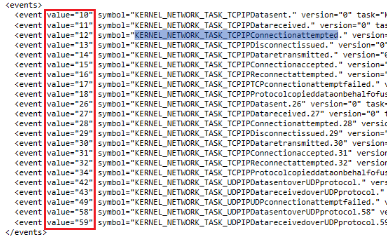
Information about a specific ETW provider is stored in an XML file called Manifest files. Reading the manifest file will give us more information regarding the capabilities of a specific ETW provider. Below image show manifest for Microsoft-Windows-Kernel-Network provider. The information in manifest is little overwhelming at first but it is very easy to understand. Only focus on the highlighted elements in the figure.
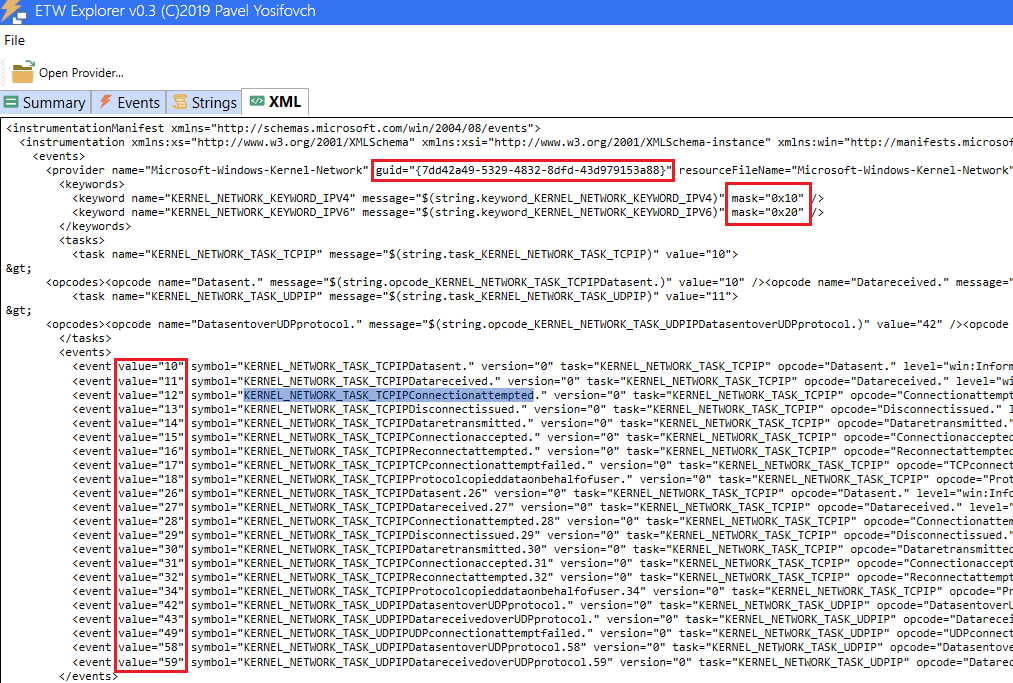
- GUID is an alternative identifier for a provider. We can use either guid id or name in Krabsetw library.
- Mask values in <keywords> tag will help us in filtering the events, we will discuss this later in the post.
- The <event value> in <events> is very important piece of data. We need this to trace a specific event by the provider. Lets say we are interested in monitoring processes that send data out of the system, then we need to use the KERNEL_NETWORK_TASK_TCPIPDatasent event with an event value of 10.
ETW provider returns some data for each of these events, we can refer to information provided in the <templates> tag in the manifest as shown below.
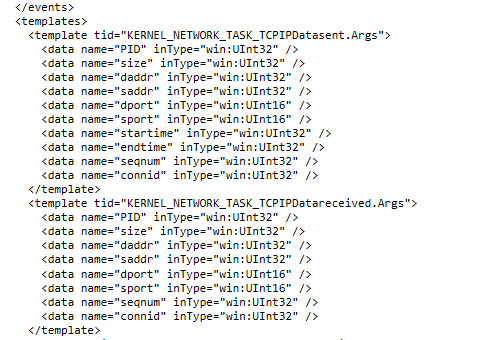
Now we know the name and the type of the data returned by the events in an ETW provider. Lets see how we can use all the above information in Krabsetw code.
krabs::provider<> network_provider(L\"Microsoft-Windows-Kernel-Network\");
//krabs::provider<> network_provider(krabs::guid(L\"{7dd42a49-5329-4832-8dfd-43d979153a88}\")); using GUID instead of the string
// The mask value in <keywords>, filter KERNEL_NETWORK_KEYWORD_IPV4
network_provider.any(0x10);
Now we have defined a Microsoft-Windows-Kernel-Network (7dd42a49-5329-4832-8dfd-43d979153a88) provider and set the filter to 0x10 which filters KERNEL_NETWORK_KEYWORD_IPV4 related events. Now we are good to go ahead and work on more event filters and call back function.
Event filters & callback
The callback function is what gets called when a specific even occurs in a tracing session. If we are interested in doing some monitoring activities to detect suspicious activities then that logic needs to be defined in the callback function.
As covered in the previous section, the <templates> tag in the manifest file has all the information on the data returned by a specific event. Lets say we are interested in KERNEL_NETWORK_TASK_TCPIPDatasent, following image shows the data returned by the event.
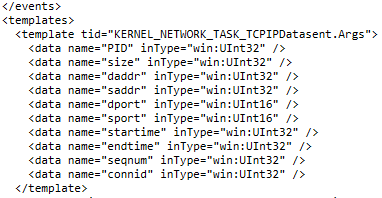
We need this information to define local variable to hold the data returned by the provider in a trace session. Below code will show how to retrieve this data.
krabs::schema schema(record, trace_context.schema_locator);
krabs::parser parser(schema);
//retrieving event specific data
uint32_t pid = parser.parse<uint32_t>(L\"PID\");
Always refer to Provider manifest to get more information on data name and types associated with events traced by a specific ETW provider. Now that out of our way, lets look at the callback function.
auto network_callback = [](const EVENT_RECORD& record, const krabs::trace_context& trace_context) {
        //retrieving event specific data
		krabs::schema schema(record, trace_context.schema_locator);
		krabs::parser parser(schema);
		uint32_t pid = parser.parse<uint32_t>(L\"PID\");

		std::cout << \"\\nProcess ID: \" << pid;


		//passing event data to an external function for further checks
		std::thread t(MonitorLogic, pid);
		t.detach();
	};
After collecting the data from the ETW provider, we are passing it to another function MonitorLogic.
Finalizing & starting the trace
Before we start our ETW trace session we need to select the event type and do more filtering. As mentioned in the section Choosing a Provider, we need to tell the ETW provider about the events we are interested in, by using the values as highlighted in the image below.
We can make use of the event value in the Krabs via predicates as show below. We are creating an event filter object network_filter which is initialized with the event value.
//KENREL_NETWORK_TASK_TCPIPDatasent
krabs::event_filter network_filter(krabs::predicates::id_is(10));
Now we can add our call back function to filter object as shown below, after integrating the call back we need to use the add_filter() of the provider class.
network_filter.add_on_event_callback(network_callback);
//integrating the filter with the provider
network_provider.add_filter(network_filter);
Now we are all set to initiate the trace session.
trace.enable(network_provider);
trace.start();
//use trace.stop() to stop the trace session
Full code (template)
#ifndef UNICODE
#define UNICODE
#endif
#include<windows.h>
#include \"krabs.hpp\"
krabs::user_trace trace(L\"COOl_ETW_TRACE\");
void MonitorLogic(DWORD pid)
{
  //Your code logic here...
}
void ETWSession()
{
   krabs::provider<> network_provider(L\"Microsoft-Windows-Kernel-Network\");
//krabs::provider<> network_provider(krabs::guid(L\"{7dd42a49-5329-4832-8dfd-43d979153a88}\")); using GUID instead of the string
// The mask value in <keywords>, filter KERNEL_NETWORK_KEYWORD_IPV4
network_provider.any(0x10);
auto network_callback = [](const EVENT_RECORD& record, const krabs::trace_context& trace_context) {
        //retrieving event specific data
		krabs::schema schema(record, trace_context.schema_locator);
		krabs::parser parser(schema);
		uint32_t pid = parser.parse<uint32_t>(L\"PID\");

		//std::cout << \"\\nProcess ID: \" << pid;


		//passing event data to an external function for further checks
		std::thread t(MonitorLogic, pid);
		t.detach();
	};
//KERNEL_NETWORK_TASK_TCPIPDatasent event
krabs::event_filter network_filter(krabs::predicates::id_is(10));
//adding the callback
network_filter.add_on_event_callback(network_callback);
//integrating the filter with the provider
network_provider.add_filter(network_filter);
//starting the trace
trace.enable(network_provider);
trace.start();
//use trace.stop() to stop the trace session
}
int main(int argc, char* argv[])
{
    // Trace session needs to be in a separate thread since the tracing is blocking in nature
	std::thread t(ETWInit);
	t.join();
}
Whenever a process on the system sends out data over the network, ETW trace will identify it and gives us data back, in our case it is PID of the process. Later this is being passed over to user defined function MonitorLogic in a separate thread.
Read these for more info
https://github.com/microsoft/krabsetw/tree/master/krabs
https://github.com/microsoft/krabsetw/blob/master/docs/KrabsExample.md
https://github.com/microsoft/krabsetw/tree/master/examples/NativeExamples
Leave a Reply