
TLDR
We focus on two issues seen in the stack (in the context of stack spoofing)
- Truncated or abruptly ending stack. (Missing RtlThreadStart and BaseThreadInitThunk)
- Thread start address not present in stack
A Custom Stack Tracer
- I have written a tool basically a stack tracer that continuously monitors stack of threads in a newly spawned process.
- Tracer obtains symbol and module information associated with return address, RIP/EIP present in each frame and start address of the target thread.
- If any issue is found it alerts the user with a dump of the trace.
Analyzing a Commercial C2 Framework loved by Adversaries
In this section we are going to discuss about a commercial C2 framework which is heavily abused by threat actors. This tool often gets cracked and sold on underground forums. The stack spoofing that comes straight out of the box creates a problematic stack. The stack tracer identified a suspicious thread with TID 51064 as shown below. Note that Thread start address has no module backed on disc.
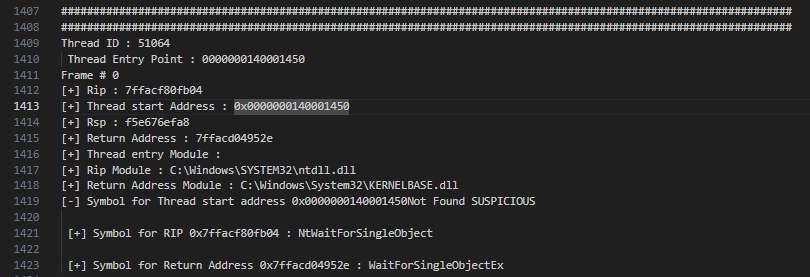
Examining the frames, we can see Web calls, but as highlighted in the image below check the return address of frame #7 , its an invalid one and yet we can see there are frames following it. Below state shows the agent is awake. Also note that thread start address is not present in any frame as return address and executing binary module is not present in stack, these are all very suspicious.

You can check the whole trace here when agent is sleeping.
##################################################################################################################
##################################################################################################################
Thread ID : 51064
 Thread Entry Point : 0000000140001450
Frame # 0
[+] Rip : 7ffacf810104
[+] Thread start Address : 0x0000000140001450
[+] Rsp : f5e676f798
[+] Return Address : 7ffacf7c51a3
[+] Thread entry Module :
[+] Rip Module : C:\Windows\SYSTEM32\ntdll.dll
[+] Return Address Module : C:\Windows\SYSTEM32\ntdll.dll
[-] Symbol for Thread start address 0x0000000140001450Not Found SUSPICIOUS

 [+] Symbol for RIP 0x7ffacf810104 : NtDelayExecution

 [+] Symbol for Return Address 0x7ffacf7c51a3 : RtlDelayExecution

Frame # 1
[+] Rip : 7ffacf7c51a3
[+] Thread start Address : 0x0000000140001450
[+] Rsp : f5e676f7a0
[+] Return Address : 7ffacd059acd
[+] Thread entry Module :
[+] Rip Module : C:\Windows\SYSTEM32\ntdll.dll
[+] Return Address Module : C:\Windows\System32\KERNELBASE.dll
[-] Symbol for Thread start address 0x0000000140001450Not Found SUSPICIOUS

 [+] Symbol for RIP 0x7ffacf7c51a3 : RtlDelayExecution

 [+] Symbol for Return Address 0x7ffacd059acd : SleepEx

Frame # 2
[+] Rip : 7ffacd059acd
[+] Thread start Address : 0x0000000140001450
[+] Rsp : f5e676f7d0
[+] Return Address : 2a93dad00d2
[+] Thread entry Module :
[+] Rip Module : C:\Windows\System32\KERNELBASE.dll
[+] Return Address Module : C:\Windows\System32\KERNELBASE.dll
[-] Symbol for Thread start address 0x0000000140001450Not Found SUSPICIOUS

 [+] Symbol for RIP 0x7ffacd059acd : SleepEx

[-] Symbol for Return Address 0x 2a93dad00d2Not Found SUSPICIOUS

Frame # 3
[+] Rip : 2a93dad00d2
[+] Thread start Address : 0x0000000140001450
[+] Rsp : f5e676f850
[+] Return Address : 2a93ba0c520
[+] Thread entry Module :
[+] Rip Module :
[+] Return Address Module :
[-] Symbol for Thread start address 0x0000000140001450Not Found SUSPICIOUS

[-] Symbol for RIP 0x2a93ba0c520Not Found SUSPICIOUS

[-] Symbol for Return Address 0x 2a93ba0c520Not Found SUSPICIOUS

Frame # 4
[+] Rip : 2a93ba0c520
[+] Thread start Address : 0x0000000140001450
[+] Rsp : f5e676f858
[+] Return Address : 2a900000000
[+] Thread entry Module :
[+] Rip Module :
[+] Return Address Module :
[-] Symbol for Thread start address 0x0000000140001450Not Found SUSPICIOUS

[-] Symbol for RIP 0x2a900000000Not Found SUSPICIOUS

[-] Symbol for Return Address 0x 2a900000000Not Found SUSPICIOUS

Frame # 5
[+] Rip : 2a900000000
[+] Thread start Address : 0x0000000140001450
[+] Rsp : f5e676f860
[+] Return Address : fffffffffd050f80
[+] Thread entry Module :
[+] Rip Module :
[+] Return Address Module :
[-] Symbol for Thread start address 0x0000000140001450Not Found SUSPICIOUS

[-] Symbol for RIP 0xfffffffffd050f80Not Found SUSPICIOUS

[-] Symbol for Return Address 0x fffffffffd050f80Not Found SUSPICIOUS

Frame # 6
[+] Rip : fffffffffd050f80
[+] Thread start Address : 0x0000000140001450
[+] Rsp : f5e676f868
[+] Return Address : 1388
[+] Thread entry Module :
[+] Rip Module :
[+] Return Address Module :
[-] Symbol for Thread start address 0x0000000140001450Not Found SUSPICIOUS

[-] Symbol for RIP 0x1388Not Found SUSPICIOUS

[-] Symbol for Return Address 0x 1388Not Found SUSPICIOUS

Frame # 7
[+] Rip : 1388
[+] Thread start Address : 0x0000000140001450
[+] Rsp : f5e676f870
[+] Return Address : 2a93bdf5040
[+] Thread entry Module :
[+] Rip Module :
[+] Return Address Module :
[-] Symbol for Thread start address 0x0000000140001450Not Found SUSPICIOUS

[-] Symbol for RIP 0x2a93bdf5040Not Found SUSPICIOUS

[-] Symbol for Return Address 0x 2a93bdf5040Not Found SUSPICIOUS

Frame # 8
[+] Rip : 2a93bdf5040
[+] Thread start Address : 0x0000000140001450
[+] Rsp : f5e676f878
[+] Return Address : 2a93c0fbf29
[+] Thread entry Module :
[+] Rip Module :
[+] Return Address Module :
[-] Symbol for Thread start address 0x0000000140001450Not Found SUSPICIOUS

[-] Symbol for RIP 0x2a93c0fbf29Not Found SUSPICIOUS

[-] Symbol for Return Address 0x 2a93c0fbf29Not Found SUSPICIOUS

Frame # 9
[+] Rip : 2a93c0fbf29
[+] Thread start Address : 0x0000000140001450
[+] Rsp : f5e676f880
[+] Return Address : 2a93c0fbf68
[+] Thread entry Module :
[+] Rip Module :
[+] Return Address Module :
[-] Symbol for Thread start address 0x0000000140001450Not Found SUSPICIOUS

[-] Symbol for RIP 0x2a93c0fbf68Not Found SUSPICIOUS

[-] Symbol for Return Address 0x 2a93c0fbf68Not Found SUSPICIOUS

Frame # a
[+] Rip : 2a93c0fbf68
[+] Thread start Address : 0x0000000140001450
[+] Rsp : f5e676f888
[+] Return Address : 1bb
[+] Thread entry Module :
[+] Rip Module :
[+] Return Address Module :
[-] Symbol for Thread start address 0x0000000140001450Not Found SUSPICIOUS

[-] Symbol for RIP 0x1bbNot Found SUSPICIOUS

[-] Symbol for Return Address 0x 1bbNot Found SUSPICIOUS

Frame # b
[+] Rip : 1bb
[+] Thread start Address : 0x0000000140001450
[+] Rsp : f5e676f890
[+] Return Address : 0
[+] Thread entry Module :
[+] Rip Module :
[+] Return Address Module :
[-] Symbol for Thread start address 0x0000000140001450Not Found SUSPICIOUS

[-] Symbol for RIP 0x0Not Found SUSPICIOUS

[-] Symbol for Return Address 0x 0Not Found SUSPICIOUS

##################################################################################################################
The trace f the stack when agent is awake
##################################################################################################################
Thread ID : 51064
 Thread Entry Point : 0000000140001450
Frame # 0
[+] Rip : 7ffacf80fb04
[+] Thread start Address : 0x0000000140001450
[+] Rsp : f5e676efa8
[+] Return Address : 7ffacd04952e
[+] Thread entry Module :
[+] Rip Module : C:\Windows\SYSTEM32\ntdll.dll
[+] Return Address Module : C:\Windows\System32\KERNELBASE.dll
[-] Symbol for Thread start address 0x0000000140001450Not Found SUSPICIOUS

 [+] Symbol for RIP 0x7ffacf80fb04 : NtWaitForSingleObject

 [+] Symbol for Return Address 0x7ffacd04952e : WaitForSingleObjectEx

Frame # 1
[+] Rip : 7ffacd04952e
[+] Thread start Address : 0x0000000140001450
[+] Rsp : f5e676efb0
[+] Return Address : 7ffab8312d63
[+] Thread entry Module :
[+] Rip Module : C:\Windows\System32\KERNELBASE.dll
[+] Return Address Module : C:\Windows\SYSTEM32\WININET.dll
[-] Symbol for Thread start address 0x0000000140001450Not Found SUSPICIOUS

 [+] Symbol for RIP 0x7ffacd04952e : WaitForSingleObjectEx

 [+] Symbol for Return Address 0x7ffab8312d63 : AppCacheGetDownloadList

Frame # 2
[+] Rip : 7ffab8312d63
[+] Thread start Address : 0x0000000140001450
[+] Rsp : f5e676f050
[+] Return Address : 7ffab83138d5
[+] Thread entry Module :
[+] Rip Module : C:\Windows\SYSTEM32\WININET.dll
[+] Return Address Module : C:\Windows\SYSTEM32\WININET.dll
[-] Symbol for Thread start address 0x0000000140001450Not Found SUSPICIOUS

 [+] Symbol for RIP 0x7ffab8312d63 : AppCacheGetDownloadList

 [+] Symbol for Return Address 0x7ffab83138d5 : AppCacheGetDownloadList

Frame # 3
[+] Rip : 7ffab83138d5
[+] Thread start Address : 0x0000000140001450
[+] Rsp : f5e676f080
[+] Return Address : 7ffab837d2d4
[+] Thread entry Module :
[+] Rip Module : C:\Windows\SYSTEM32\WININET.dll
[+] Return Address Module : C:\Windows\SYSTEM32\WININET.dll
[-] Symbol for Thread start address 0x0000000140001450Not Found SUSPICIOUS

 [+] Symbol for RIP 0x7ffab83138d5 : AppCacheGetDownloadList

 [+] Symbol for Return Address 0x7ffab837d2d4 : InternetCloseHandle

Frame # 4
[+] Rip : 7ffab837d2d4
[+] Thread start Address : 0x0000000140001450
[+] Rsp : f5e676f0b0
[+] Return Address : 7ffab83dac85
[+] Thread entry Module :
[+] Rip Module : C:\Windows\SYSTEM32\WININET.dll
[+] Return Address Module : C:\Windows\SYSTEM32\WININET.dll
[-] Symbol for Thread start address 0x0000000140001450Not Found SUSPICIOUS

 [+] Symbol for RIP 0x7ffab837d2d4 : InternetCloseHandle

 [+] Symbol for Return Address 0x7ffab83dac85 : HttpSendRequestA

Frame # 5
[+] Rip : 7ffab83dac85
[+] Thread start Address : 0x0000000140001450
[+] Rsp : f5e676f270
[+] Return Address : 7ffab83dabf8
[+] Thread entry Module :
[+] Rip Module : C:\Windows\SYSTEM32\WININET.dll
[+] Return Address Module : C:\Windows\SYSTEM32\WININET.dll
[-] Symbol for Thread start address 0x0000000140001450Not Found SUSPICIOUS

 [+] Symbol for RIP 0x7ffab83dac85 : HttpSendRequestA

 [+] Symbol for Return Address 0x7ffab83dabf8 : HttpSendRequestA

Frame # 6
[+] Rip : 7ffab83dabf8
[+] Thread start Address : 0x0000000140001450
[+] Rsp : f5e676f2e0
[+] Return Address : 2a93c0fd8d0
[+] Thread entry Module :
[+] Rip Module : C:\Windows\SYSTEM32\WININET.dll
[+] Return Address Module : C:\Windows\SYSTEM32\WININET.dll
[-] Symbol for Thread start address 0x0000000140001450Not Found SUSPICIOUS

 [+] Symbol for RIP 0x7ffab83dabf8 : HttpSendRequestA

[-] Symbol for Return Address 0x 2a93c0fd8d0Not Found SUSPICIOUS

Frame # 7
[+] Rip : 2a93c0fd8d0
[+] Thread start Address : 0x0000000140001450
[+] Rsp : f5e676f380
[+] Return Address : ffffffffffffffff
[+] Thread entry Module :
[+] Rip Module :
[+] Return Address Module :
[-] Symbol for Thread start address 0x0000000140001450Not Found SUSPICIOUS

[-] Symbol for RIP 0xffffffffffffffffNot Found SUSPICIOUS

[-] Symbol for Return Address 0x ffffffffffffffffNot Found SUSPICIOUS

Frame # 8
[+] Rip : ffffffffffffffff
[+] Thread start Address : 0x0000000140001450
[+] Rsp : f5e676f388
[+] Return Address : f5e676f480
[+] Thread entry Module :
[+] Rip Module :
[+] Return Address Module :
[-] Symbol for Thread start address 0x0000000140001450Not Found SUSPICIOUS

[-] Symbol for RIP 0xf5e676f480Not Found SUSPICIOUS

[-] Symbol for Return Address 0x f5e676f480Not Found SUSPICIOUS

Frame # 9
[+] Rip : f5e676f480
[+] Thread start Address : 0x0000000140001450
[+] Rsp : f5e676f390
[+] Return Address : 0
[+] Thread entry Module :
[+] Rip Module :
[+] Return Address Module :
[-] Symbol for Thread start address 0x0000000140001450Not Found SUSPICIOUS

[-] Symbol for RIP 0x0Not Found SUSPICIOUS

[-] Symbol for Return Address 0x 0Not Found SUSPICIOUS
Lets check the stack with Windows PRocExp. To my surprise ProcExp trace produced more clean trace, the 0x0000000140001450 is nowhere to be found. But of course this is not a perfect stack, it ending abruptly, no RtlThreadStart or BaseThreadInitThunk calls present in any frame.
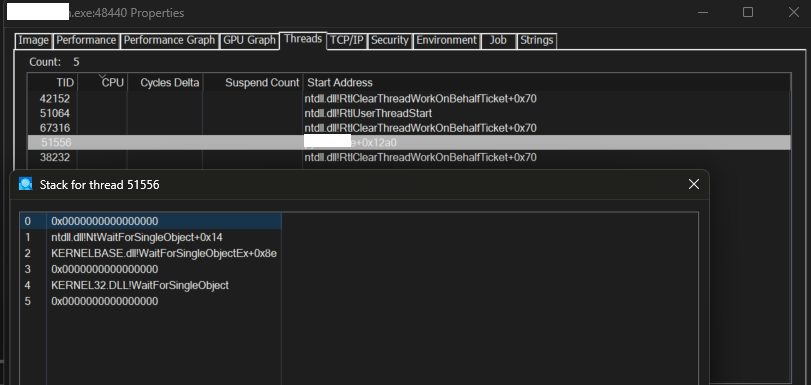

Lets check with Process Hacker(PH).
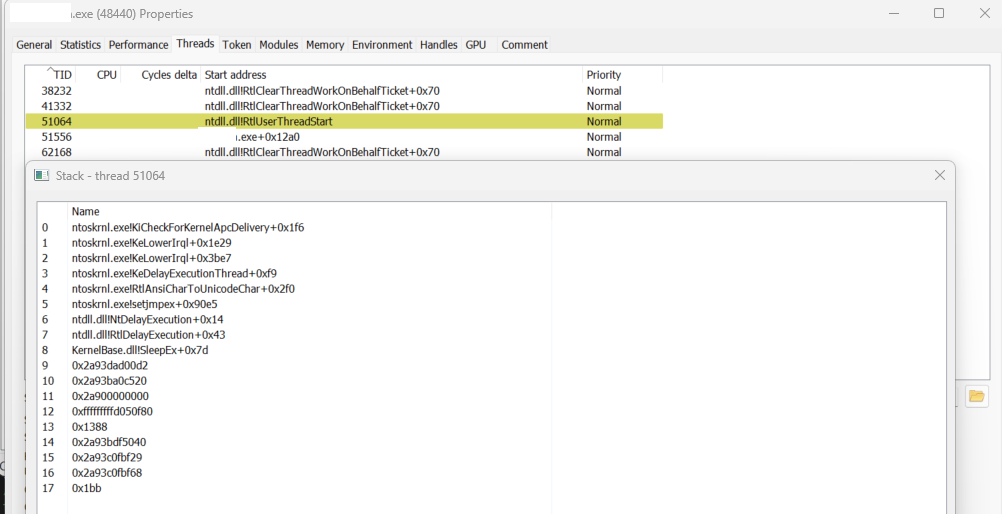
Trace produced by the PH is same as the one produced by my tracer. You can go back and check the return addresses in each frame shown in the trace for agent during the sleep.
Here we can see many addresses that have no file backing. Its a trivial indicator.
But one thing really confused me – the thread start address for 51064. In my tracer, the address is shown as 0x0000000140001450 and has no associated module or any symbols. But here in the reace produced by PH we can see the start address is shown as RtlUserThreadStart which is very weird. This was a rabbit hoel for me at the time of conducting the analysis. But finally a comment in the Process Hacker source code saved me.

What happening here is the thread start address info displayed by the PH depends on symbol resolution. One way to obtain thread info is basically calling NtQueryInformationThread by passing ThreadQuerySetWin32StartAddress (0x9) as THREADINFOCLASS. This is referred as Win32StartAddress. Another way to obtain thread info is by calling NtQuerySystemInformationby passing SYSTEMPROCESSINFORMATION (0x5) as SystemInformationClass. Here structure returned by api will have a member StartAddress for each thread present in each running process on system. PH refers this as StartAddress.
So in our case ThreadQuerySetWin32StartAddress points to 0x0000000140001450, which obviously cannot be resolved into module + offset format, hence it falls back on to StartAddress which points to RtlUserThreadStart for that thread.
Analyzing CallStackMasker : A stack too perfect
Callstackmasker project is an interesting project from Fortra, the POC replaces the stack of the Main thread with one already available on the system. There is one catch, the tool only replicates a stack that has KERNELBASE!WaitForSingleObjectEx and ntdll!NtWaitForSingleObjec frames present.
At the time of testing POC on my system, an svchost.exe with PID 10388 has a thread with TID 13512 that meets the above condition. This thread is highlighted in the image below. The code is executed from WlanRadioManager.dll.
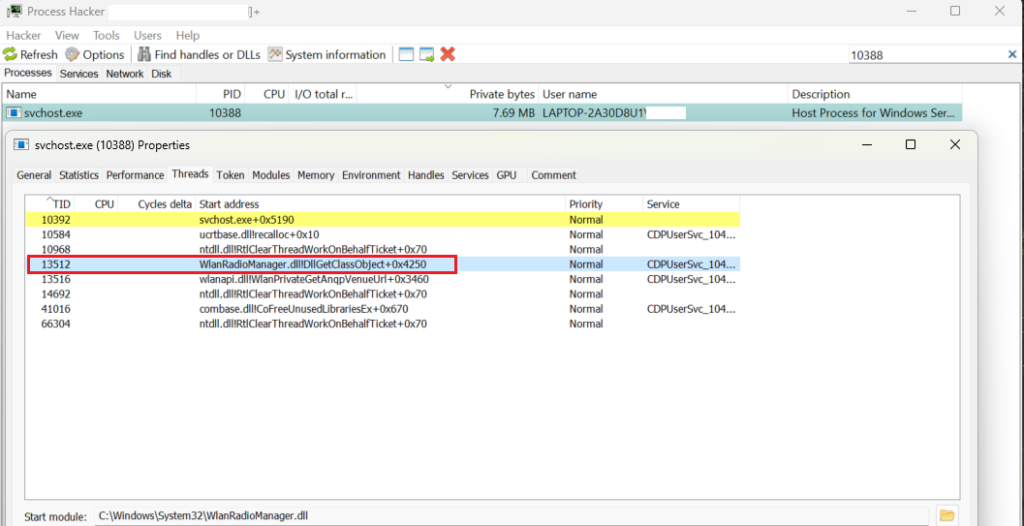
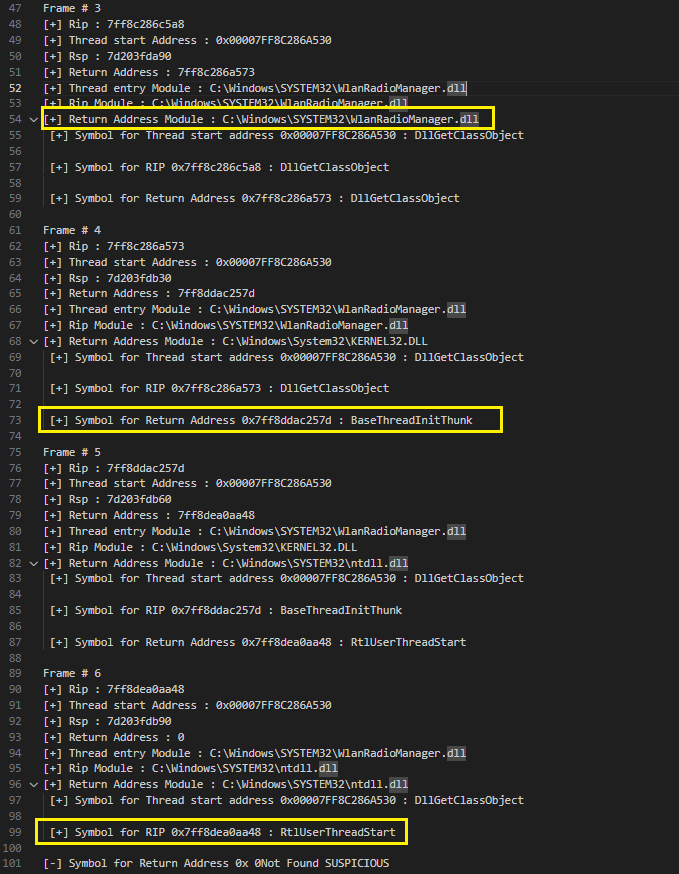
Below image shows initial three frames of Main thread of POC traced by my custom stack tracer. The execution of the thread starts from RtlThreadStart which is followed by a call to BaseThreadInitThunk and in Frame #4 we can see execution of code in WlanRadioManager.dll!DllGetClassObject. Check RIP and thread entry module in Frame #4, which points to WlanRadioManager.dll, this is the expected state of a normal thread. The thread start address needs to be present on the stack. Why is this the case? lets look at the state of the stack when the Main thread stack is not masked (spoofed).
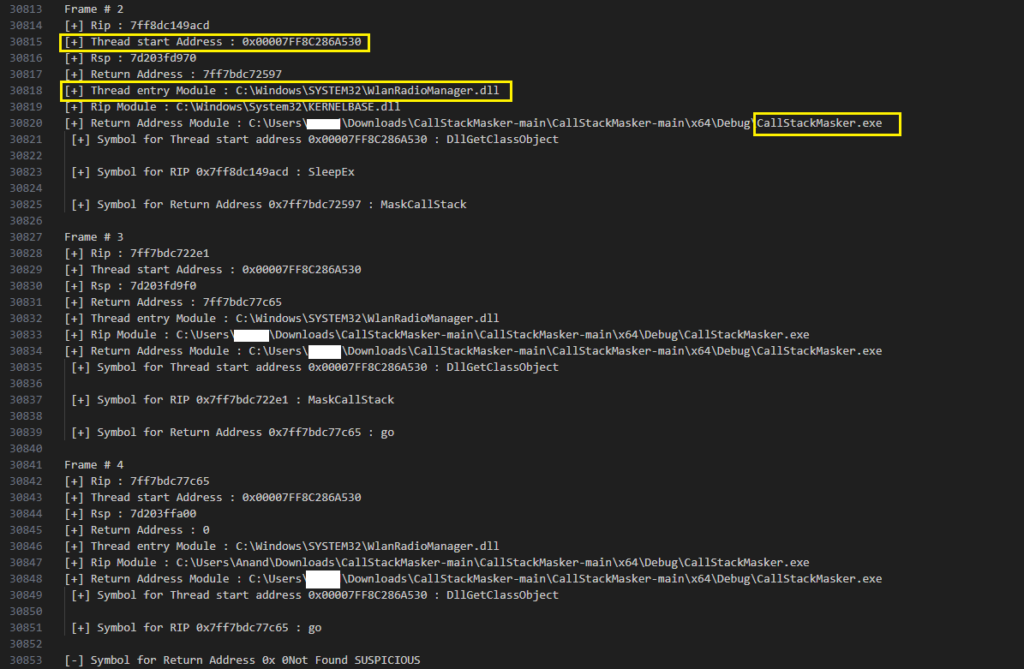
One important point to note is the name of the compiled POC executable is CallStackMasker.exe which is nowhere to be found in the trace.
The below image shows the Main thread when it is not spoofed, now we can see the name of our POC executable. But examine the Thread start address, the thread start entry module is still pointing to wlanRadioManager.dll and symbol for the same is showing DllGetClassObject. Interestingly by examining the return addresses present in each frame, there is a not a singlr address that points to wlanRadioManager.dll!DllGetClassObject, meaning the thread entry address is not present in the stack, this is one sticks out as a sore thumb. Also the stack is not unwinding to usual BaseThreadInitThunk and RtlThreadStart calls.
The tracer has the capability to identify such anomalies as you can see in the image below, a message is being printed “Start address not found in the trace”

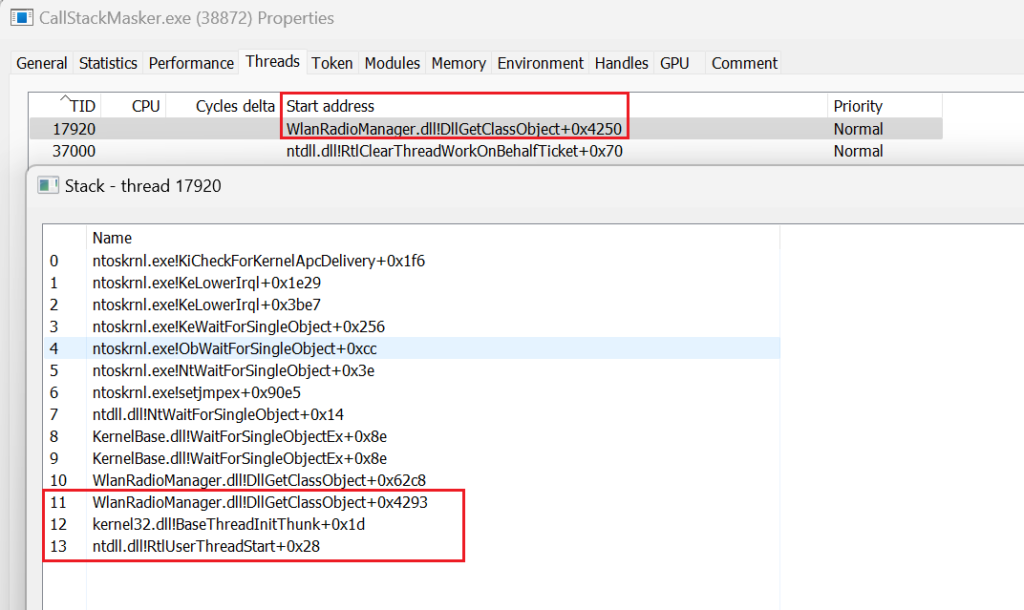
Using GUI of Process Hacker we can see the issues in the thread as shown below. We can clearly see thread start address is present in the stack trace produced by PH. There is no sign of CallStackMasker.exe string as well in the trace.
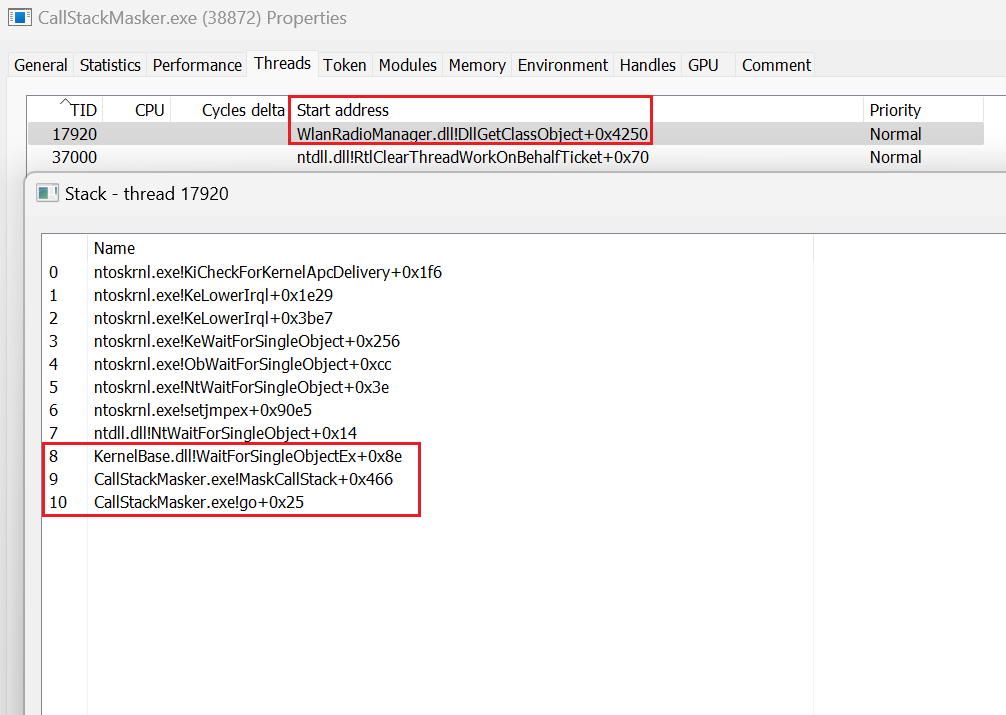
But when the stack is unmasked, we can see the name of our binary and thread start address is not present in the trace.
The Crazy Fearless Honey Weasel In The Wild
In this section we discuss anomalies in the thread present in one of the popular commercial C2 framework, loved by professionals, that ships evasive capabilities right out of the box.
My tracer picked one interesting thread where its start address is nowhere to be found in the trace, interestingly as shown below, the trace shows in frame #4 there is a call to HttpSendRequestA, we can assume c2 activity, where stack is not properly masked.
I have masked out symbol info for the thread start address as this a strong indicator to detect this framework. This is consistent across multiple versions, thanks to folks in the community to let me do the testing 🙂

The tracer identifies this thread stack as abnormal and alert message is produces as shown below.

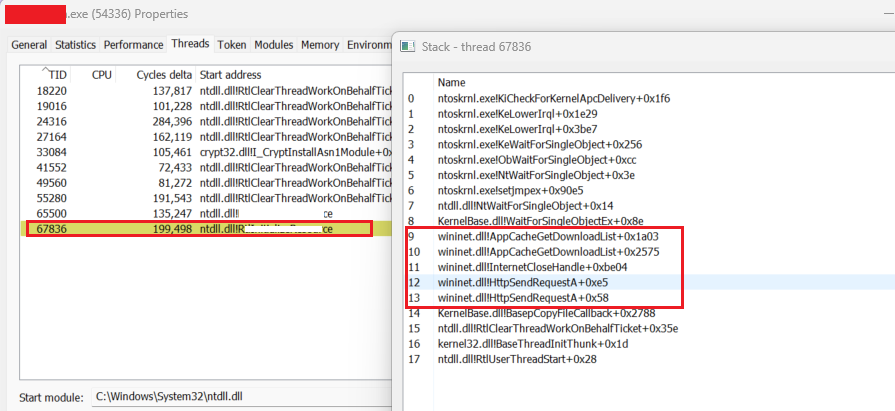
The below screen shots show output from PH. The problematic thread highlighted in the trace above is shown the red box below. The state of the stack at the time of sleep is shown on right. The symbol(redacted) for the start address is not seen in the trace.
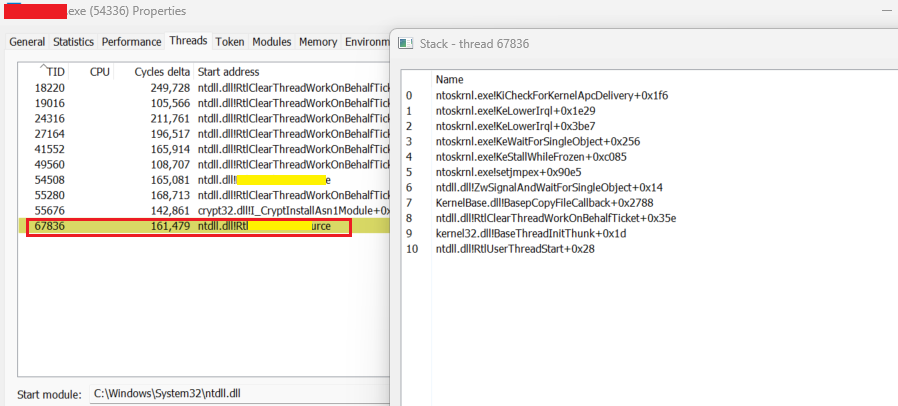
Below image shows the state of the stack when beconing happens, the issue still persists.
Demon’s Stack Duplication
Havoc C2 agent Demon’s approach to stack spoofing is bit different, the demon swaps its NtTib (member in TEB) with NtTib of another thread in its own process. It takes back up of NtTib before doing the swap. So that when it wakes up from the sleep it can restore the thread to its original state. Check sleep obfuscation source code here. The below image shows this process.
Check out TEB structure here at GeoffChappell.
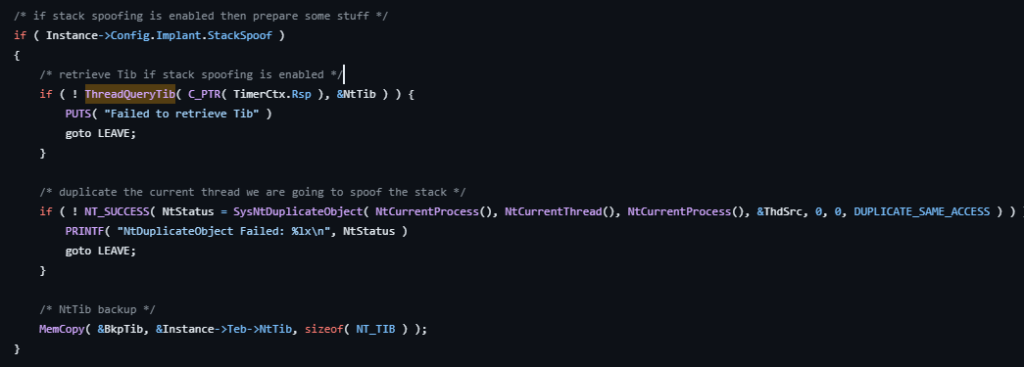
The NtTib swap is shown below.
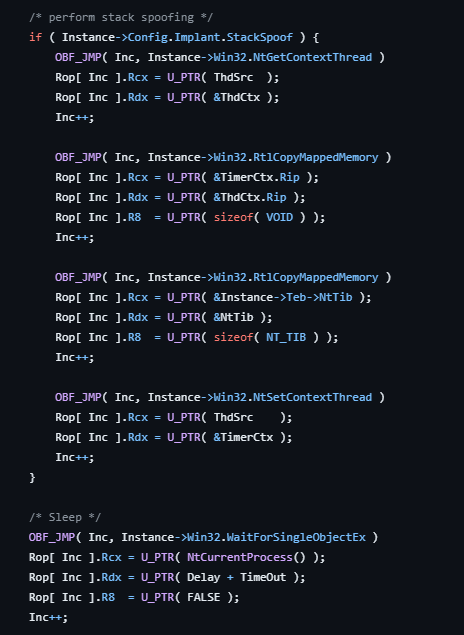
Below image shows the process of restoring NtTib back to its original state when the demon wakes up form sleep.
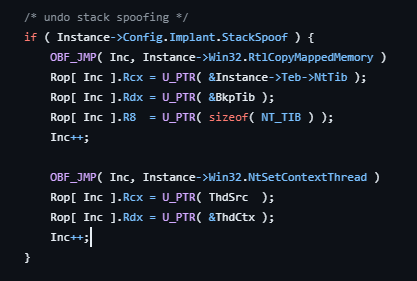
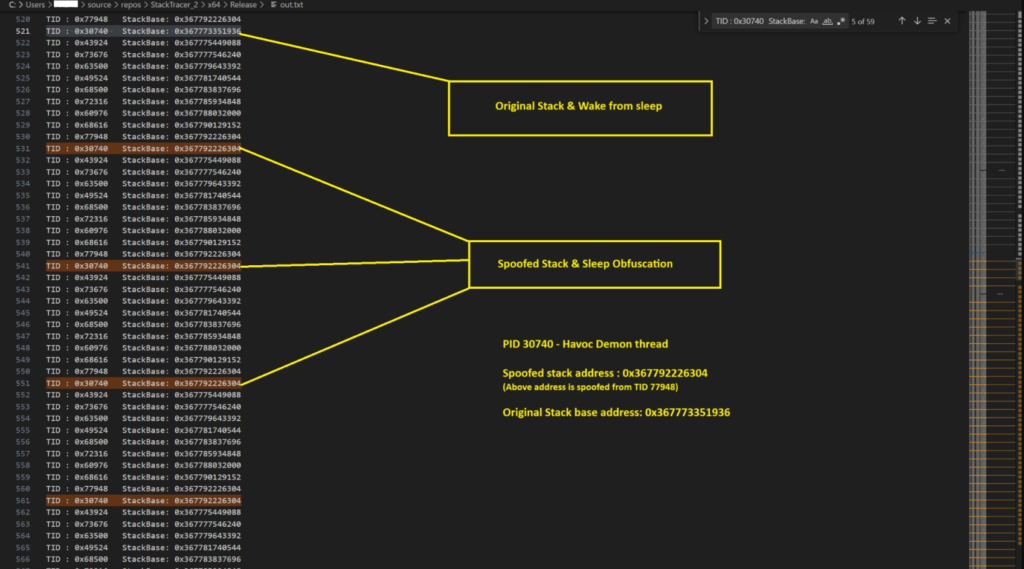
This type of stack manipulation can detected by monitoring StackBase address of a thread. Below image shows the Havoc sleep obfuscation in action. The base address of the thread with TID 30740 fluctuates, more interestingly its base address matches with that of thread with TID 77948, this pattern occurs in a periodic nature. Whenever the thread 30740 has base address of 77948, demon is sleeping in the memory. When the it wakes up from sleep, we can see its actual thread base address 0x367773351936
Leave a Reply